Software details

EViews是Econometrics Views的缩写,直译为计量经济学观察,通常称为计量经济学软件包。它的本意是对社会经济关系与经济活动的数量规律,采用计量经济学方法与技术进行“观察”。计量经济学研究的核心是设计模型、收集资料、估计模型、检验模型、应用模型(结构分析、经济预测、政策评价)。EViews是完成上述任务比较得力的必不可少的工具。正是由于EViews等计量经济学软件包的出现,使计量经济学取得了长足的进步,发展成为一门较为实用与严谨的经济学科。
EViews是在Windows操作系统中计量经济学软件里世界性领导软件。强而有力和灵活性加上一个便于使用者操作的界面;最新的建模工具,快速直觉且容易使用的软件。由于它革新的图表使用者界面和精密的分析引擎工具,EViews 是强大,灵活性和便于使用的功能。EViews 预测分析计量软件在科学数据分析与评价、金融分析、经济预测、销售预测和成本分析等领域应用非常广泛。 EViews软件在Windows环境下运行,操作接口容易上手,使得本来复杂的数据分析过程变得易学易用。
EViews是专门从事数据分析、回归分析和预测的工具。其处理的基本数据对象是时间序列,每个序列有一个名称,只要提及序列的名称就可以对序列中所有的观察值进行操作,并允许用户以简便的可视化的方式从键盘或磁盘文件中输入数据,根据已有的序列生成新的序列,在屏幕上显示序列或打印机上打印输出序列,对序列之间存在的关系进行统计分析。
EViews的强大功能和容易使用使得它成为任何需要处理时间序列,横截面,或纵向(longitudina)数据人员的理想软件包。通过EViews,您可以快速和有效的管理您的数据,执行计量经济学和统计分析,生成预测或模型仿真,和产生可用于出版或包含到其它应用程序中的高质量的图形和表格。
创新图形化面对对象的用户界面和强大的分析引擎,EViews完美结合了现代软件技术和您需要的特征,在一个灵活的界面下提供了空前强大的功能。

◎主要功能
◆ 采用统一的方式管理数据,通过对象、视图和过程实现对数据的各种操作;
◆ 输入、扩展和修改时间序列数据或截面数据,依据已有序列按任意复杂的公式生成新的序列;
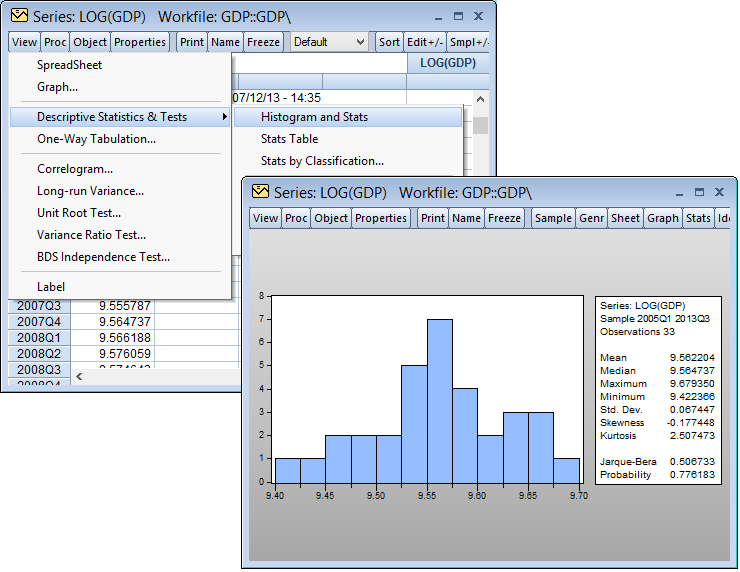
◆ 计算描述统计量:相关系数、协方差、自相关系数、互相关系数和直方图;
◆ 进行T 检验、方差分析、协整检验、Granger 因果检验;
◆ 执行普通最小二乘法、带有自回归校正的最小二乘法、两阶段最小二乘法和三阶段最小二乘法、非线性最小二乘法、广义矩估计法、ARCH 模型估计法等;
◆ 对二择一决策模型进行Probit、logit 和Gompit 估计;
◆ 对联立方程进行线性和非线性的估计;
◆ 估计和分析向量自回归系统;
◆ 多项式分布滞后模型的估计;
◆ 回归方程的预测;
◆ 模型的求解和模拟;
◆ 数据库管理;
◆ 与外部软件进行数据交换
EViews 12提供了一系列令人兴奋的更改和改进,下面是版本12中最重要的新特性的概述。
界面
◆ 新的基于文本的文件格式。
◆ 支持Markdown language输出。
◆ 其他改进。
数据处理能力改进
◆ 支持DBNomics API数据库。
◆ 支持 经济合作与发展组织(OECD)API数据库。
◆ SDMX和EIA数据库接口的改进。
◆ 其他改进。
图形、表格和线轴
◆ 按样本着色,使着色更容易。
◆ 动画图形和地理图。
◆ X-Y误差条。
◆ 其他改进
计量经济与统计计算
预估、评估方面
◆ 变量选择方法:套索和自动搜索/获取。
◆ 指示器饱和-自动异常值和结构断裂检测。
◆ 分数积分GARCH模型(FIGARCH和FIEGARCH)。
◆ 弹性网,脊和套索增强。
◆ 面板聚类协方差。
◆ 混合频率(MIDAS)增强功能。
◆ 功能系数增强。
检测与诊断方面
◆ 脉冲响应增强,包括引导协方差。
◆ 横截面相关面板单位根试验(第二代试验)。
◆ 因子选择方法。
◆ 小波分解。
◆ 弹性网,脊和套索增强。
◆ GARCH诊断:新闻冲击曲线,符号偏差测试,稳定性测试。
模型改进
◆ 解决目标控制问题。
◆ 代数转换内生和外生变量。
◆ 依赖关系。
EViews 11提供了一系列令人兴奋的更改和改进,下面是版本11中最重要的新特性的概述
EViews 界面最新改进
◆ 交互式命令资源管理器,用于查看对象及其文档的所有适用命令。
◆ 名称和命令自动完成。
◆ 基于价值的电子表格和地图(Geomap)着色。
EViews 最新的数据处理
◆ 与Python集成。
◆ 重复分析。
◆ 分段观测高低频转换法。
◆ 接口到以下数据源:
• 经济分析局(BEA)
• 美国人口普查
• 国家海洋和大气管理局
EViews图形、表格和线轴的最新增加
◆ 地理地图
◆ 风扇图表
EViews计量经济与统计计算最近改进
预估、评估方面
◆ 改进贝叶斯var
◆ 混合频率var
◆ 切换VARs (Markov和simple)
◆ 弹性网和套索机器学习
◆ 函数系数和局部回归
◆ 额外的集群健壮性标准错误
检测与诊断方面
◆ 周期单位根检验 (Seasonal unit root tests. )
2017年7月初,IHS公司发布了EViews软件最新的版本V10,包含了很多的功能改进和更新,包括:
EViews界面
◆自动和用户控制的工作文件历史、快照和备份系统
◆电子表格视图的实时统计信息
◆支持长对象名称
◆增强的日志记录功能
数据处理
◆改善了和R软件的兼容性
◆属性导入和导出
◆与世界银行数据的接口
◆与联合国数据的接口
◆与欧盟统计局数据接口
◆保存到Tableau
◆保存到JSON
图形、表格和线轴
◆气泡图
◆图表的一系列更新
◆新的默认图样式
◆各种新的图形选项
◆表格排序
计量经济与统计计算
◆Season-trend分解(STL)
◆MoveReg每周季节性调整
◆特殊函数的计算
估算
◆平滑阈值回归(STR)
◆异方差一致的稳健标准误差选项
◆集群标准误差
◆var和线性限制
◆结构VAR约束的改进
◆VAR历史分解
◆改进的非线性预测
◆附加自回归的分布式延迟(ARDL)工具
测试与专业术语
◆VAR结构残差
◆改进的VAR序列相关检验
◆模型边界检查
WHAT IS EVIEWS?
EViews is a modern econometric, statistics, and forecasting package that offers powerful analytical tools within a flexible, easy-to-use interface.
Using EViews, you can quickly and efficiently manage your data, perform econometric and statistical analysis, generate forecasts or model simulations, and produce high quality graphs and tables for publication or inclusion in other applications.
EViews is designed with your workflow in mind. The innovative EViews user-interface simplies every step of the process, from data input and import, to data visualization, statistical analysis, estimation, forecasting and model solving, publication quality presentation output.
Need to import Excel data? Just drag-and-drop your Excel file onto EViews and we'll automatically import the data. Need to produce a histogram of your data? A couple of mouse clicks, and you're done. Want to link your custom formatted table into PowerPoint? Simply copy-and-paste the table and tell PowerPoint to update the table when your EViews data change.
WHY SHOULD I USE EVIEWS?
We know that you have many options when it comes to software. So why should you choose EViews?
The innovative EViews interface is easy use, having been designed from the ground-up to take advantage of modern Windows operating systems. Most users are able to master the interface within minutes of first being introduced to EViews. There is no complicated syntax to learn - a few mouse strokes or keyboard clicks and you're off and running!
EViews integrates with your other Windows products. In addition to opening and saving to a large range of different file formats (from webpages to Excel to Stata or SAS), EViews supports standard Windows technologies such as copy-and-pasting, object linking and embedding, and ODBC connections.
Although EViews' core design features a mouse driven user-interface, EViews also offers an extensive programming and command language. All actions in EViews can be scripted to automate repetitive tasks, or to keep a record of your work.
●EViews Interface
Automatic and user-controlled workfile history, snapshot and backup system.
Live statistics for spreadsheet views.
Support for long object names.
Enhanced logging abilities.
●Data Handling
Improved integration with R.
Attribute importing and exporting.
Interface to World Bank data.
Interface to United Nations data.
Interface to Eurostat data.
Interface to European Central Bank data.
Saving to Tableau®.
Saving to JSON.
●Graphs, Tables and Spools
Bubble plots.
Series updating in graphs.
New default graph styles.
Miscellaneous new graph options.
Table sorting.
●Econometrics and Statistics
Computation
Season-trend decomposition (STL).
MoveReg weekly seasonal adjustment.
Special function computation.
Estimation
Smooth threshold regression (STR).
Heteroskedasticity consistent robust stardard error options.
Clustered stardard errors.
VARs with linear restrictions.
Structural VAR restriction improvements.
VAR historical decomposition.
Improved nonlinear forecasting.
Additional autoregressive distributed lag (ARDL) tools.
Testing and Diagnostics
VAR structural residuals.
Improved VAR serial correlation testing.
Model bounds checking.
系统要求
CPU:
Pentium或更高
操作系统:
Windows 10 (32bit or 64bit)
Windows 8.1 (32bit or 64bit)
Windows 8 (32bit or 64bit)
Windows 7 (32bit or 64bit)
Windows Vista (32bit or 64bit)
Windows Server 2016 (32bit or 64bit)
Windows Server 2012 (32bit or 64bit)
Windows Server 2008 (32bit or 64bit)
.Net 4.0 需要连接到特定的外部数据库和安装eview - excel外接程序
内存:
512MB
磁盘空间:
400 MB可用硬盘空间用于EViews可执行文件、支持文件、完整文档和示例文件
如需了解更多详情,请拨打我们的咨询热线400-806-8806或联系info@keruanwang.com